The Real Estate Market in Milan: A Survey on Residential Transactions
Author: Michele Branca
Date: 26-01-2024
INTRODUCTION
This paper starts with a broad and general view of the residential property market and its dynamics, and then goes into more detail and depth on the Milan market. For this reason, the research is divided into three sections: in the first section, the context of the real estate market was examined in depth, with a particular focus on the residential market in the Italian and Milan markets. This in-depth study showed that the property market is closely linked to external dynamics, mainly macroeconomic variables such as GDP, public debt, monetary policy, the credit market and inflation.
At this point, interest focused on whether there were internal market dynamics and whether they had different effects in different markets. Thanks to the relevant literature, it was discovered that internal market dynamics, given by the combination of primary supply and demand and secondary supply and demand in response to changing external dynamics, reflect cyclical phases in price trends and the number of property transactions. This gives rise to a particular pattern in the residential property market, known as the honeycomb cycle or hexagonal model, which consists of 6 phases reflecting different combinations of price and volume trends. This is where the second part of the research in this paper comes in, which is dedicated to investigating whether the Milan market can adhere to this particular cyclical pattern and whether it can indeed be compared with that of other markets, such as the national market. The results of this initial research lead us to believe that the price behaviour in Milan is unique compared to other markets. For this reason, the research continues with a third part, which aims to identify the characteristics that influence the sale of a property and, in particular, to understand what determines the price in the Milan market.
METHODOLOGICAL APPROACH
In the first research, with the aim of producing graphical representations to highlight the cyclical nature of the market in the combined trend between buying and selling volumes and property prices, the following steps were taken:
- DATA COLLECTION:
The source used for residential property prices is the Istat database. Data on residential property transactions are taken from the ‘Osservatorio Immobiliare’ database of Agenzia delle Entrate. Prices were collected as an annual sequence in the form of the house price index (Ipab) (with base 100 in 2015) from 2011 to 2022. Transactions were collected as a quarterly sequence of the number of normalised transactions (NTN) from 2011 to 2022;
- DATA INTEGRATION:
In order to make the two series consistent and comparable, an indexing process of the NTN has been carried out, producing an annual index of transactions (with base 100 in 2015) comparable to the price index (Ipab);
- GRAPHIC DESIGN:
Two types of graphs have been produced for the markets considered (Italy, Milan and Turin): a line graph to assess the evolution of the two curves; a price/transaction graph with the indices on the axes and the values expressed by a point for each year observed (to highlight the shape of the hexagonal cyclical pattern).
In the second research, with the aim of identifying the variables that have a significant impact on the value and timing of the sale of a property, an analysis was carried out using two linear multiple regression models, using the SPSS statistical software with the ‘Enter’ method. The steps involved in running the models were as follows:
- DATA COLLECTION:
A dataset provided by the company Wikicasa was used, with more than 260,000 properties transacted through the sales advertisements on the Wikicasa.it portal between 2019 and 2023. Each property (rows) is associated with a set of characteristics (columns);
- DATA SELECTION:
Only sales-related listings were selected (more than 150,000 properties). From these, properties in the following categories were filtered and used: flat; penthouse; detached house; loft; villa; terraced house;
- DATA CLEANING:
The following removals from the dataset were made to improve usability for regression analysis: removal of properties with missing data; removal of properties without a removal date from the portal; removal of outliers;
- PRELIMINARY ANALYSIS:
A univariate descriptive analysis was performed on the variables, specifically the mean, standard deviation, skewness and kurtosis. A multicollinearity analysis was then carried out using the correlation matrix and VIF analysis.
Finally, the removal or aggregation of certain variables was carried out to solve correlation problems;
- REGRESSION ANALYSIS:
Two models were constructed using multiple linear regression for the independent variables price and sales time.
RESULTS ANALYSIS
Regarding the results of the first research:
The graph of the hexagonal model represents the idea of the ‘Honeycomb cycle’ with prices on the abscissas and transactions on the ordinates. Because of its shape, it is also known as the hexagonal model. According to the theory, the cycle is destined to repeat itself with the chronological succession of the 6 phases, which predict different combinations in the trends of transactions and house prices.

Figure 1: Hexagonal model
Another study, carried out by the Agenzia del Territorio’s Statistics and Studies Office on the real estate market, identifies the first three phases of the cycle in the Italian market from 2001 to 2010. The graph for Italy shows that from 2011 to 2022 there is indeed a continuation of the cycle with the fourth phase up to 2013, the fifth from 2013 to 2015, and the sixth phase, with a stationarity in prices, from 2015 to 2019. The value for 2020 is obviously affected by the consequences of the covid pandemic, which probably acted as a brake on the repetition of the cycle. However, the values for 2021 and 2022 could suggest a resumption of the cyclical pattern, starting again from phase 1.
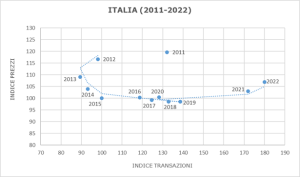
Figure 2: Honeycomb cycle’s graph for Italy
In the analysis of Milan, the graph shows trends very similar to the results for Italy in terms of transactions, but completely different in terms of prices. For this reason, it was not possible to identify phase 3 and phase 6 of the model for Milan, i.e. the phases with a period of price stability. For Milan, there is an exponential increase in prices from 2015 onwards. On the contrary, the case of Turin shows that the model can indeed be applied to both a metropolitan and a national context. However, compared to the Italian market, there are slight differences in terms of the time lag between the phases.
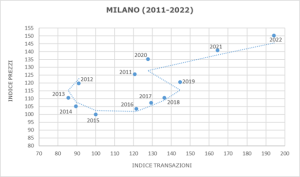
Figure 3: Honeycomb cycle’s graph for Milan
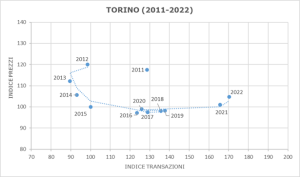
Figure 4: Honeycomb cycle’s graph for Turin
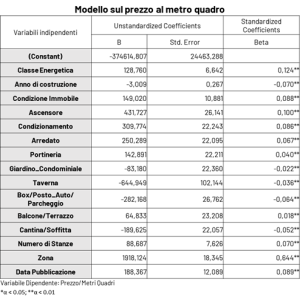
Attention will now turn to the results of the second investigation, which concerns the regression model on the price per square metre of a property.
The coefficient of determination is quite high, over 0.6, which means that this dependent variable can be explained to a large extent by the independent variables we see on the right. Looking at the standardised beta coefficients, which express a relative measure of the impact of x on the dependent variable, it is clear that area is the variable with the highest coefficient, at 0.644. This is followed, in order of magnitude, by the energy class, with a beta of 0.124, the lift, with 0.100, the date of publication and the condition of the property, both with coefficients slightly below 0.1. The remaining variables, although significant in the model, have a very residual influence, in relative terms, on the value of the price per square metre.

CONCLUSIONS
In conclusion, this work has allowed us to understand that the Italian residential property market goes through cyclical phases and follows the hexagonal or honeycomb cycle with the combined trend of prices and transactions observed previously. This cycle seems to last about twenty years, with slight differences between the national market and the metropolitan level, mainly due to a time lag in the occurrence of cyclical phases. This evidence of the repetition of certain developments in the market has important strategic implications for investors, as suggested in the literature, who can benefit from a kind of wait-and-see effect on developments and assess the opportunities or risks of investments.
Another insight relevant to the market is the importance of the volume of sales transactions, which plays a fundamental role in making the market particularly responsive, much more than price, to both exogenous and endogenous factors. In periods of price stability, found in the third and sixth phases of the hexagonal model, internal market dynamics are created in which demand and secondary supply are of fundamental importance: applicants (and suppliers) can indeed react to external changes by changing volume without affecting prices.
The first research, analysing Milan, showed that although the trend in terms of transactions is practically identical to that of the Italian and Turin markets, the price trend is unique compared to other markets. This is not only due to the significantly higher growth in property values, but also to the high price dynamics, which do not respect the periods of cyclical stagnation observed in other markets. One can almost see an independence of prices from external factors, but above all it is necessary to consider the fact that there is probably an imbalance between supply and demand, as shown in the first chapter of this work. On the other hand, the IMI index (an indicator that measures the intensity of a real estate market and represents the movement of the real estate market in terms of sales transactions made on the total stock of real estate in the area concerned) is actually higher in Milan than in other cities. These reasons then generate a continuous expectation of growth and confidence on the part of investors and consumers, creating a virtuous circle.
The factor that most determines the price of a property in Milan is the area and, in the analysis, has shown how impacting the distance from the city centre, which involves a significant increase in values to embrace the central areas. This is linked to the fact that supply in the city of Milan is not able to keep up with demand and in the most central areas, the market is saturated. The evidence presented in the first chapter suggests that the city of Milan, understood as an urban centre, has a higher percentage of small buildings than other cities and studios. In this sense, a dynamic of lack of space has been created, which testifies to the saturation of the market in the central areas.
Hence the link with the phenomenon, deepened in the first phase of the research, of the migration of housing demand from the city to the periphery and the province, apparently motivated by economic reasons and the increased availability of housing. In support of this, it is useful to note that the dataset used for the regression analysis consists of around 75% of property advertisements placed in the ‘periphery’ category, and much lower percentages for the more central areas. This phenomenon will gradually lead to a greater incorporation of the periphery and the province into the boundaries of the city, which will be increasingly difficult to define. Thanks to an efficient transport structure, the spread of hybrid work and the reasons just mentioned, the process of “gentrification” will therefore continue, a process that is both sociological and economic in nature, in terms of urban redevelopment and the revaluation of property values. It is a process that involves the increasing urbanisation of peripheral and marginal urban areas.
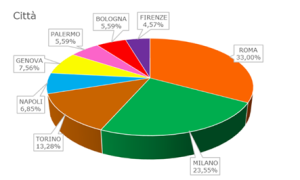
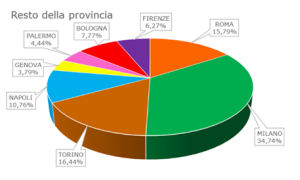

Figure 5: On the left NTN 2022 shares of metropolitan areas by dwelling size classes; on the right NTN 2022 shares of major provinces by size classes of dwellings
In conclusion, it can be argued that the market is developing, at least in part, a green trend. This trend is characterised by the search for properties with more sustainable and energy-efficient characteristics, but also, and more importantly, on the supply side, new buildings are much more energy-efficient than average. This is particularly relevant in the light of the recent European Directive on the Energy Performance of Buildings, which requires all residential buildings to be class E by 2030 and class D by 2033. General will therefore seems to be driving the market in this direction.
Further studies and future research could deepen the dynamics within the housing sector and, in particular, it would be necessary to have data to separate buyers and sellers of dwellings into primary and secondary applicants and suppliers. In this way it would be possible to distinguish the primary market from those buying or selling existing properties. This separation should ensure that it is possible to study how primary and secondary participants react in different market conditions, thus allowing a deeper understanding of the factors influencing the production of new dwellings and the functioning of internal market dynamics.

