
Does not sleeping make you anxious?
Sleep is one of the activities necessary to be able to live, but how much sleep is needed? What effect does lack of sleep have?
These questions form the basis of a study published in Depression and Anxiety that investigates how and to what extent the individual need for sleep can affect disorders such as anxiety, defined as a psychophysical disorder characterised by tension, worry and restlessness.
The idea is to explore associations between anxiety and sleep disorders in order to identify who suffers most from them within the young adult population, considered a population at risk for these disorders, distinguishing by gender and by activity (study vs. work).
Approximately 2,000 students and 1,000 workers, aged between 20 and 27, were surveyed and asked by questionnaire to answer questions concerning their sleep habits and sleep levels: e.g. how much they slept and how much they would like to sleep. All these data were used as a screening tool and measure of severity for generalised anxiety disorder (GAD). This dataset was re-processed by us using a Bayesian approach with the aim of predicting the likelihood of having a certain level of anxiety as a function of different sleep needs and other variables collected from the responses of the participating subjects.
The level of anxiety is estimated with a score from 0 to 21, divided into four bands:
– 0-4: minimal anxiety
– 5-9: mild anxiety
– 10-14: moderate anxiety
– 15-21: severe anxiety
The sample under review was balanced between men and women and students and workers, as can be seen from both graphs.
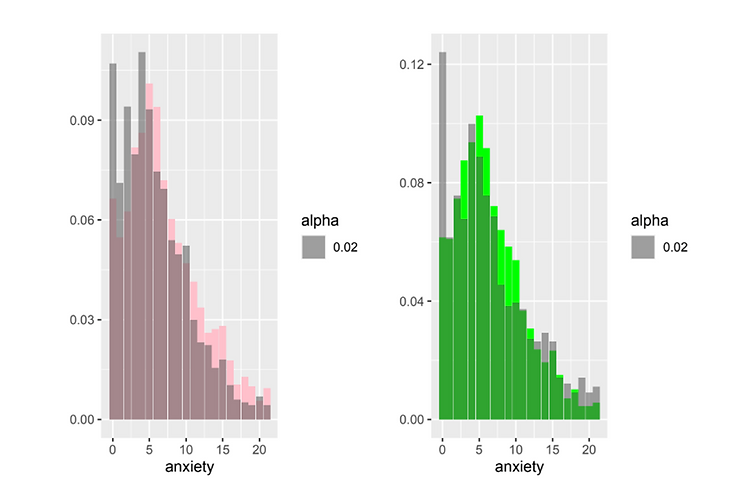
Figure 1 distributions of anxiety level M(grey) vs F(pink) (Sx) and Students(green)i vs Workers(grey) (Dx)
Since anxiety is measured in discrete ordinal levels, a model was chosen that could reflect this particular characteristic. Ordinal and discrete means an outcome such as ranking positions at the end of a running race: first, second third etc.. In the analysis, it must also be taken into account that people tend to weight their answers (in surveys, answering questionnaires) according to an innate continuous metric scale.
The model assumes that the metric of the variables is normally distributed, although people have some sort of threshold for each response category. In the model, thresholds were identified with the quantiles of the underlying normal distribution…
The variables found to be most significant for this model were:
lwsleep -> daily average of sleeping hours, calculated over the last week
sleepdebt -> sleep debt, i.e. hours less slept than the hours of sleep perceived as optimal by the subject
gender -> female (1) or male (0)
depression -> degree of depression
workers-> workers (1) or students (0)
The data analysis was done with a linear regression, i.e. assuming a linear relationship between the level of anxiety and the independent variables…
Analyses revealed a significant importance of the variables sleepdebt and lwsleep: both increasing the sleep debt and decreasing the hours slept increases the level of anxiety.
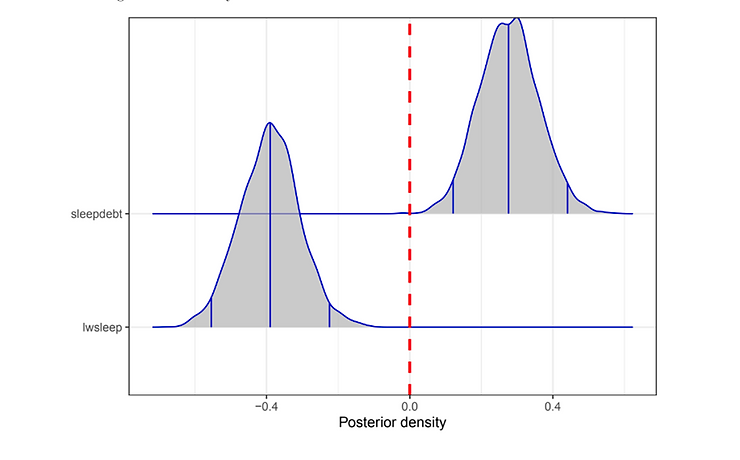
The graph demonstrates the shifting of the probability distributions, initially centred on the zero value, to higher (sleepdebt) or lower (lwsleep) values respectively, but it is noted that no further statements can be made about the magnitude of the effect since we are considering variables that are not continuous.
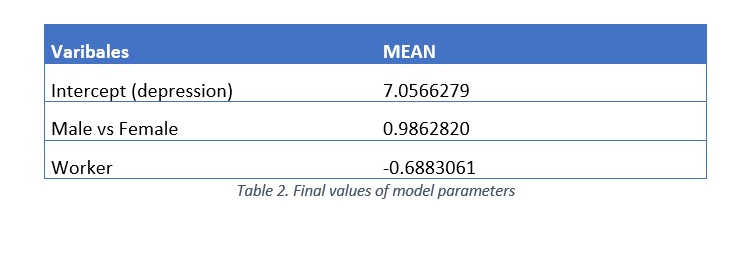
With regard to the characteristics of the subjects (males vs. females and workers vs. students), it can be seen that being female significantly increases the possibility of having anxiety while being a worker decreases it (negative sign).
# LEVELS OF ANXIETY
The result of the regression, i.e. of all our tests, gives us a number from which we can then relate to the levels of anxiety on the international scales.
As can be seen from the graph, the population sample is distributed more on intermediate threshold levels where the population is more likely to be found. Thanks to Bayesian statistical techniques, we can give greater importance to the more numerous thresholds, thus creating boundaries between thresholds that are no longer equal in magnitude but proportionate.
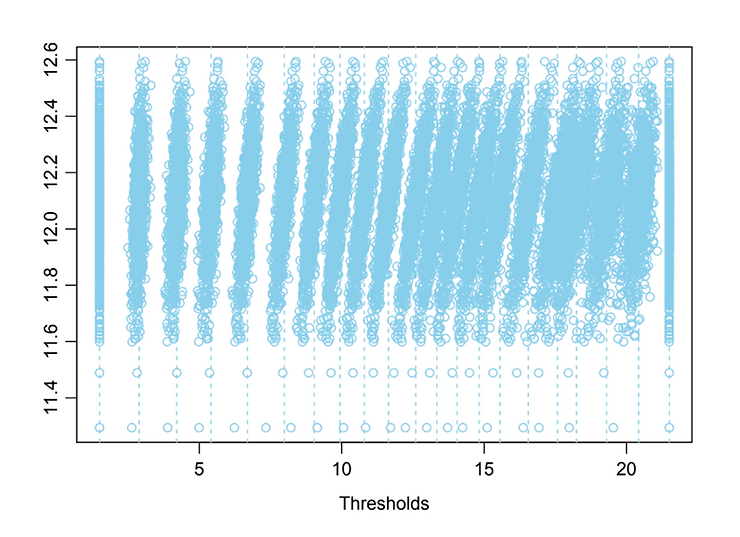
Like level 13, 14 and even more evident in 17 and 18.
# PREDICTIONS
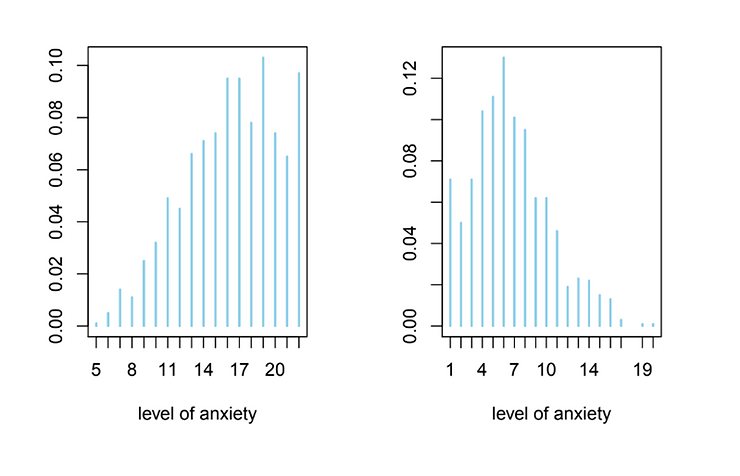
Once the model has been defined and validated, it can be used to predict the probability of having a certain level of anxiety for a single subject. As an example of prediction allowed by the model, let us consider two subjects of opposite characteristics:
A. A student with a high level of depression and mild sleep deprivation
B. a male worker, with a low level of depression and little sleep.
The results are shown in the figure. As can be seen in subject A, the probability is highest for levels corresponding to the severe anxiety category (15-21) while in subject B, the probability is highest in the mild anxiety range (5-9).
# TECHNICAL NOTES
Analyses were carried out with the use of Bayesian statistics, which made it possible to obtain probability distributions for the predictions, although starting from an essentially neutral initial situation in the absence of information or assumptions about the system’s behaviour.
Dickinson DL, Wolkow AP, Rajaratnam SMW, Drummond SPA. Personal sleep debt and daytime sleepiness mediate the relationship between sleep and mental health outcomes in young adults. Depress Anxiety. 2018 Aug;35(8):775-783
Questionnaires are globally used and created specifically for this type of study
Spitzer RL, Kroenke K, Williams JB, et al. A brief measure for assessing generalised anxiety disorder: the GAD-7. Arch Intern Med. 2006 May 22 166(10):1092-7
Degree of depression calculated using the PHQ-2 scale with values from 0-6


